Understanding the various sources of revenue that sustain hospitals and physician practices is fundamental to effective healthcare management. Payer mix—the distribution of payments from different insurance and patient categories—directly influences financial stability and operational planning. As a hospital medical director, gaining a comprehensive grasp of payer mix methodologies, benchmarks, and improvement tactics is essential for […]
Understanding the various sources of revenue that sustain hospitals and physician practices is fundamental to effective healthcare management. Payer mix—the distribution of payments from different insurance and patient categories—directly influences financial stability and operational planning. As a hospital medical director, gaining a comprehensive grasp of payer mix methodologies, benchmarks, and improvement tactics is essential for […]
Understanding the various sources of revenue that sustain hospitals and physician practices is fundamental to effective healthcare management. Payer mix—the distribution of payments from different insurance and patient categories—directly influences financial stability and operational planning. As a hospital medical director, gaining a comprehensive grasp of payer mix methodologies, benchmarks, and improvement tactics is essential for optimizing revenue streams and ensuring community service.
Getting a clear picture of how reimbursement sources impact your institution involves exploring different ways to measure and interpret payer data. From analyzing patient demographics to assessing revenue contributions, each approach provides unique insights. This understanding allows healthcare leaders to make informed decisions that balance community obligations with financial sustainability.
How is Payer Mix Defined?
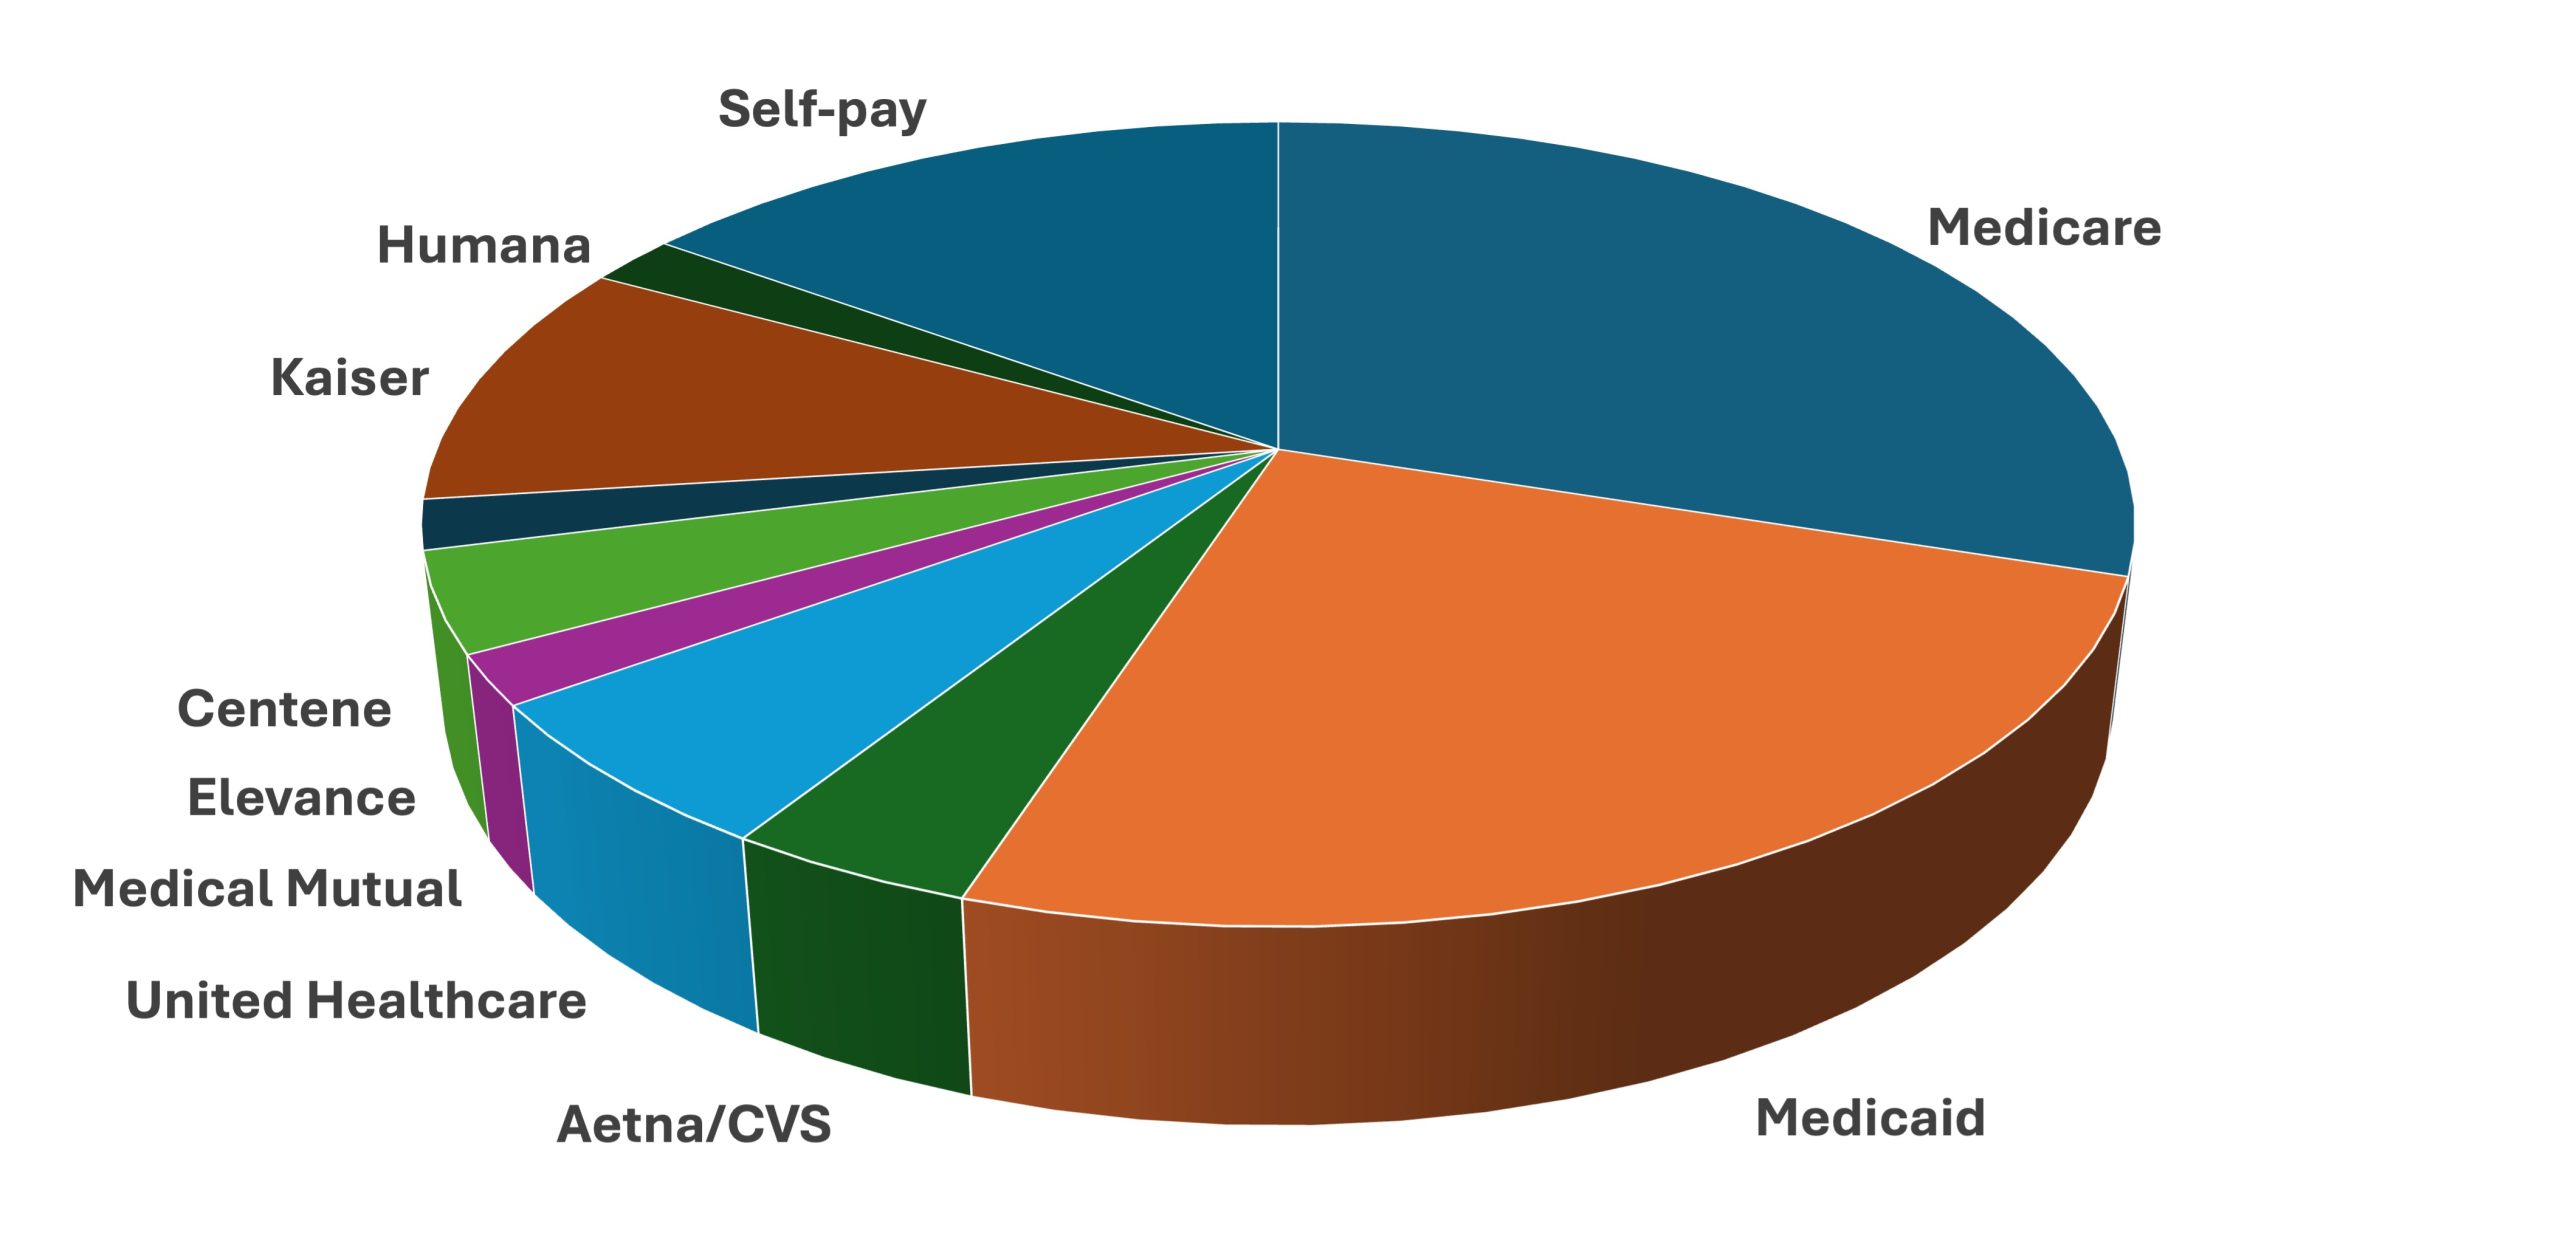
Broadly, payer mix refers to the proportion of revenue derived from various payers within a healthcare setting. The primary payers typically include Medicare, Medicaid, private commercial insurers, and self-paying patients. Depending on the institution’s focus and patient population, other payers such as workers’ compensation, Department of Veterans Affairs, Department of Defense, or research grants may also play a role.
Accurately analyzing payer mix requires familiarity with multiple measurement methods, each with its own advantages and limitations. Employing several approaches simultaneously provides a more nuanced understanding of financial health. For example, the payer mix based on the patient population offers quick demographic insights, but it may not accurately reflect revenue or effort. In contrast, analyzing receipts reveals actual income contributions, although it omits considerations like care complexity and resource utilization.
- Payer mix by patient counts considers the percentage of patients with each payer type. For instance, if a practice has 1,000 patients—450 with commercial insurance, 300 Medicare, 150 Medicaid, and 100 uninsured—the payer distribution is 45%, 30%, 15%, and 10%, respectively. While straightforward, this method doesn’t account for differences in resource intensity or reimbursement rates.
- Revenue-based payer analysis examines the percentage of annual income from each payer. For example, billing $100,000 with $50,000 from commercial insurance, $30,000 from Medicare, $19,000 from Medicaid, and $1,000 from self-pay patients indicates a payer mix of 50%, 30%, 19%, and 1%. This method highlights where the income truly originates but can be skewed by payer reimbursement disparities.
- Charge-based analysis calculates payer contributions based on billed charges, which are often inflated list prices. Since actual payments are frequently lower due to negotiated discounts, this method can misrepresent true revenue contributions but may be useful for financial planning and pricing strategies.
- Patient days measurement, primarily relevant for hospitals, captures the payer distribution over hospital stays. Longer stays for Medicare patients, for instance, skew the payer mix toward older populations, influencing hospital resource allocation.
- RVU-based approach evaluates payer mix according to relative value units, reflecting the actual physician effort and resource utilization. This method distinguishes between payers by the workload associated with their cases, offering a more precise picture of revenue relative to physician effort.
What is the Average Payer Mix?
Benchmarking your practice’s payer mix against regional or national standards helps evaluate financial health. A payer mix more favorable than the benchmark suggests sustainability, whereas a worse-than-average mix indicates potential financial challenges requiring strategic adjustments.
Using population data from sources such as the U.S. Census provides a starting point. For example, nationally, 67% of Americans are covered by private insurance, 37% by public programs like Medicare and Medicaid, and around 8% are uninsured. However, these figures vary significantly by region and demographic factors like age, urbanization, and socioeconomic status.
It’s important to recognize that healthcare utilization is not uniform across populations. Medicare and Medicaid populations tend to have higher medical needs and utilization rates, which can distort direct comparisons. Relying solely on population coverage may not accurately reflect the payer mix in a specific practice, emphasizing the need for more precise measures like expenditure-based benchmarks.
Healthcare expenditure analysis from sources such as CMS reveals that private insurance accounts for the largest share of healthcare spending, followed by government programs. In 2022, total U.S. healthcare expenditures surpassed $4.46 trillion, with private insurers paying the majority of hospital and physician costs. Recognizing these national trends aids in setting realistic expectations and strategic goals for payer mix management.
Reimbursement Varies by Payer
Payment amounts differ significantly depending on the payer source. Hospitals and physicians often charge list prices that are subject to negotiated discounts with insurers. These negotiated rates—referred to as “contractual agreements”—are confidential and can vary widely among payers, impacting the actual revenue received.
For example, a hospital bill may display the sticker price, the negotiated contractual amount with an insurer, patient co-pays, and adjustments. Importantly, no one typically pays the listed price; Medicare, Medicaid, and private insurers pay amounts governed by standardized fee schedules or negotiated contracts. As a result, the sticker price is largely irrelevant to actual reimbursement, especially for publicly funded payers.
In the case of Medicaid, reimbursement rates are often significantly below Medicare—averaging around 72% nationally—and vary by state and specialty. Many physicians limit accepting Medicaid due to low payment rates, affecting the payer mix. Conversely, commercial insurance tends to reimburse at higher rates—often exceeding 140% of Medicare—making a higher proportion of commercially insured patients financially advantageous.
The variability in reimbursement underscores the importance of strategic contract negotiations. Hospitals and practices that develop favorable agreements with insurers can significantly improve their financial outlook. For instance, some practices negotiate supplemental payments through state programs like the Medicaid Upper Payment Limit Program, which allows for higher reimbursements in certain contexts. Such efforts can dramatically improve payer mix quality and financial stability.
Payer Mix Varies by Hospital Size and Type
Larger hospitals generally have a higher proportion of reimbursable payers such as Medicaid and commercial insurance. Data from the 2023 Medicare Cost Report indicates that in larger institutions, the payer mix leans more toward private payers, whereas smaller hospitals tend to have a higher percentage of Medicare and Medicaid due to their patient demographics.
Similarly, the type of hospital influences payer distribution. For example, psychiatric hospitals often see a higher percentage of privately insured patients, while critical access hospitals tend to have a higher share of Medicare patients. Pediatric hospitals are typically characterized by a low percentage of Medicare and Medicaid, with a higher proportion of commercial insurance and CHIP coverage, and very low self-pay rates because most families qualify for assistance.
Payer Mix Varies by Geography
Regional differences significantly influence payer composition. States with a high percentage of retirees, such as Florida, have a larger Medicare population—around 23%—compared to states like Vermont, where only about 12% are on Medicare. Military-heavy states, like Hawaii, have higher TRICARE coverage, while others have minimal military populations.
These geographic variations are driven by demographic factors, state Medicaid expansion policies, and employment patterns. Recognizing these local trends is critical when benchmarking and planning your practice’s payer mix strategies. For instance, practices in states with high Medicaid coverage must account for lower reimbursement rates, while those in wealthier states may benefit from a higher influx of commercially insured patients.
The Ideal Payer Mix
While a 100% reliance on commercial insurance would maximize reimbursement, it is practically unattainable. Non-profit hospitals and practices are legally required to provide charity care and cannot refuse Medicaid or uninsured patients, which inherently influences their payer composition. Laws like EMTALA mandate emergency care regardless of payer status, further anchoring payer diversity.
Balancing community service with financial viability involves understanding your local demographics and setting realistic goals. Begin by analyzing regional population coverage data, then adjust based on patient age, hospital type, and community needs. Comparing your actual payer mix against this tailored benchmark allows you to identify areas for improvement.
Improving Your Payer Mix
Transforming payer composition is challenging once a practice is established, but targeted strategies can help. For example, reducing self-pay patients by assisting eligible individuals in enrolling for Medicaid or marketplace plans can dramatically improve payer mix. During Medicaid expansion in Ohio, such efforts lowered self-pay from 13.5% to 3%.
Other tactics include setting income-based payment plans, expanding services attractive to commercially insured groups—such as screening programs or specialty services—and enhancing outreach through advertising and partnerships with employers. Negotiating favorable insurance contracts, emphasizing the practice’s strengths, and leveraging IT tools like patient portals and online scheduling can also attract more private payers.
The Cost of Payer Mix Optimization
Investing in payer mix management requires resources—staff time, marketing, IT upgrades, and contract negotiations. Larger practices and hospitals with dedicated administrative teams are better positioned to implement these strategies successfully. The financial benefits of improving payer mix, such as higher reimbursements and reduced uncompensated care, often outweigh these investments, making strategic resource allocation essential.
Achieving an optimal payer mix involves continuous monitoring, analysis, and adaptation. By aligning your practice’s payer composition with regional benchmarks and community needs, you can enhance both financial sustainability and community service. Exploring innovations like the potential of AI for healthcare can further support these efforts through predictive analytics and targeted outreach.
References: